Is the Nasdaq 100 Bullish or Bearish? How to Analyze It
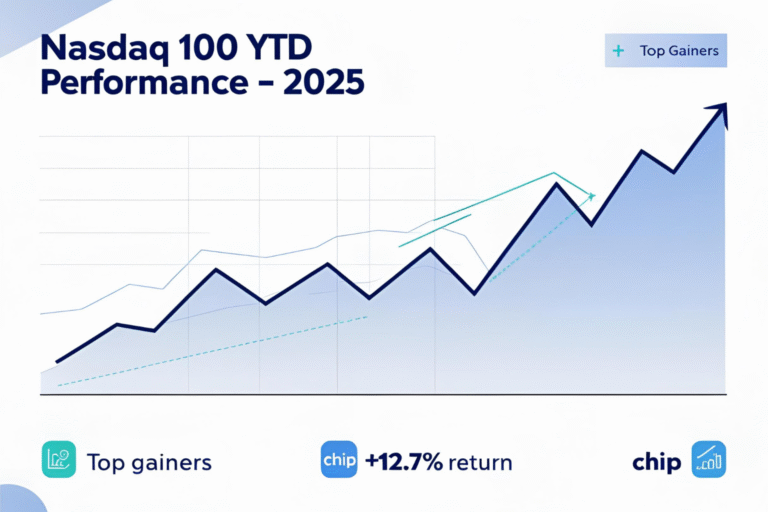
Many traders and investors ask, “Is the Nasdaq 100 bullish or bearish?” This question is crucial because the Nasdaq 100 is a key indicator of market sentiment, especially in the technology and growth sectors.
To answer this, we must rely on technical analysis, economic news, and broader market conditions.
What Does Bullish or Bearish Mean?
- A bullish market means prices are expected to rise.
- A bearish market means prices are expected to fall.
These terms describe the overall sentiment and momentum in the market. For the Nasdaq 100, sentiment can shift rapidly due to tech stock earnings, Federal Reserve decisions, or global news.
Key Tools to Analyze Nasdaq 100 Trends
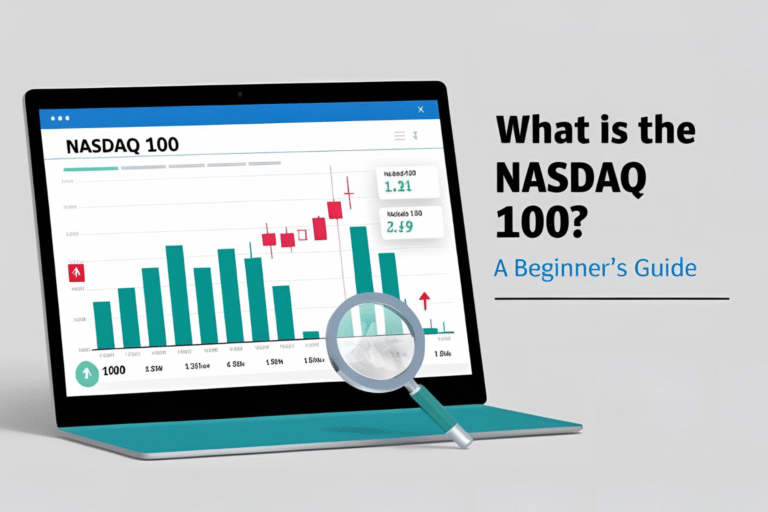
- Technical Charts
Use price charts like candlestick or line charts to identify trends and patterns. Look for higher highs and higher lows for bullish setups, or lower highs and lower lows for bearish ones. - Moving Averages
- When the price stays above the 50-day or 200-day moving average, it’s generally bullish.
- A crossover below these lines often signals bearish momentum.
- RSI and MACD
- Relative Strength Index (RSI) helps determine if the index is overbought or oversold.
- MACD crossover trends help confirm upward or downward momentum.
- Volume Analysis
Volume spikes during uptrends may confirm bullish sentiment, while increasing volume in downtrends suggests bearish pressure. - News and Economic Reports
Fed rate announcements, inflation data, and tech earnings can all influence Nasdaq 100 direction.
How to Interpret Bullish or Bearish Sentiment
- Bullish Signals
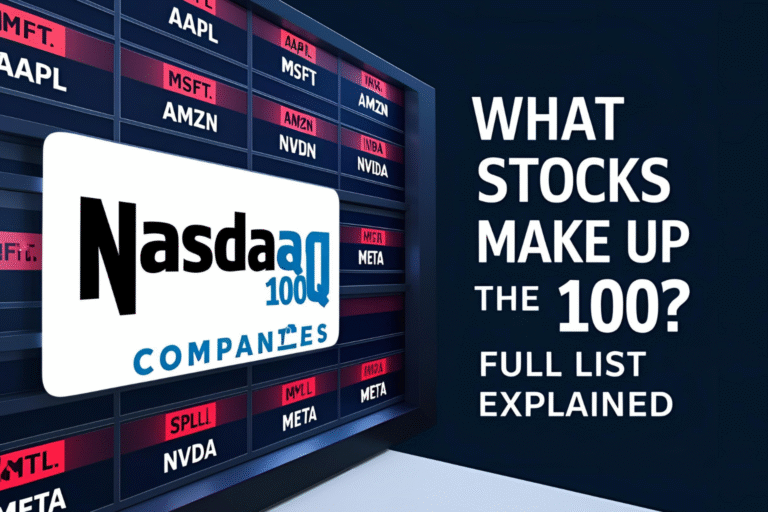
- Strong earnings from Apple, Microsoft, Amazon
- Rising tech sector performance
- Positive economic outlook
- Index breaking above key resistance levels
- Bearish Signals
- Rate hikes or hawkish Fed statements
- Poor earnings reports in major tech firms
- High inflation or recession fears
- Index failing to hold support levels
Should You Buy or Sell Based on Trend?
Short-term traders use technical indicators to decide whether to go long or short on NAS100. Long-term investors often ride out short-term corrections and buy during dips in a bearish cycle.
Always combine multiple indicators to confirm your analysis and manage your risk properly.
Final Thoughts
Answering the question “Is the Nasdaq 100 bullish or bearish?” requires a blend of technical analysis, market news, and experience. Trends can shift quickly, so staying informed and using proper tools is essential for smart trading or investing decisions.
FAQs
How do I know if the Nasdaq 100 is bullish today?
Check real-time charts, price momentum, and market news. If it’s above key moving averages and gaining volume, it’s likely bullish.
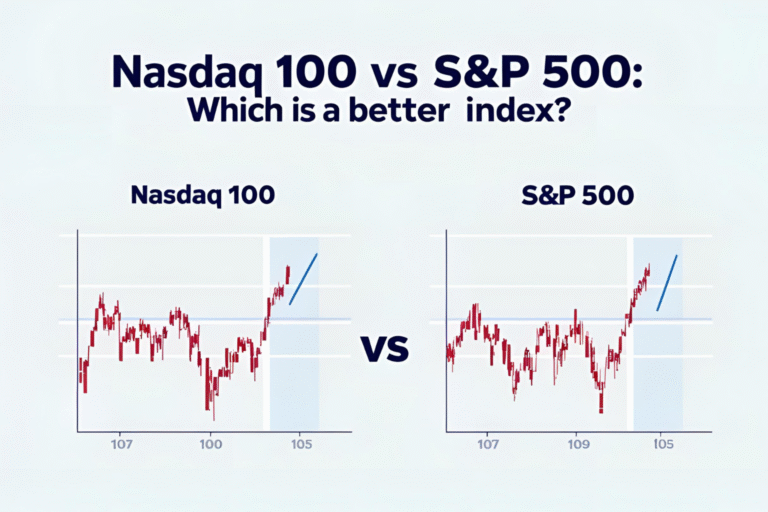
Can the Nasdaq 100 be bearish while the S&P 500 is bullish?
Yes. The Nasdaq 100 is more tech-focused and may react differently to sector-specific news.
What indicators confirm a bearish trend in the Nasdaq 100?
Falling price below moving averages, RSI below 30, and lower lows on the chart.
How often does the Nasdaq 100 change trend direction?
It depends on market cycles, economic data, and investor sentiment. Trends can last days to months.
Should I trade NAS100 during bearish markets?
Yes, but be cautious. Use stop-loss orders and proper risk management.