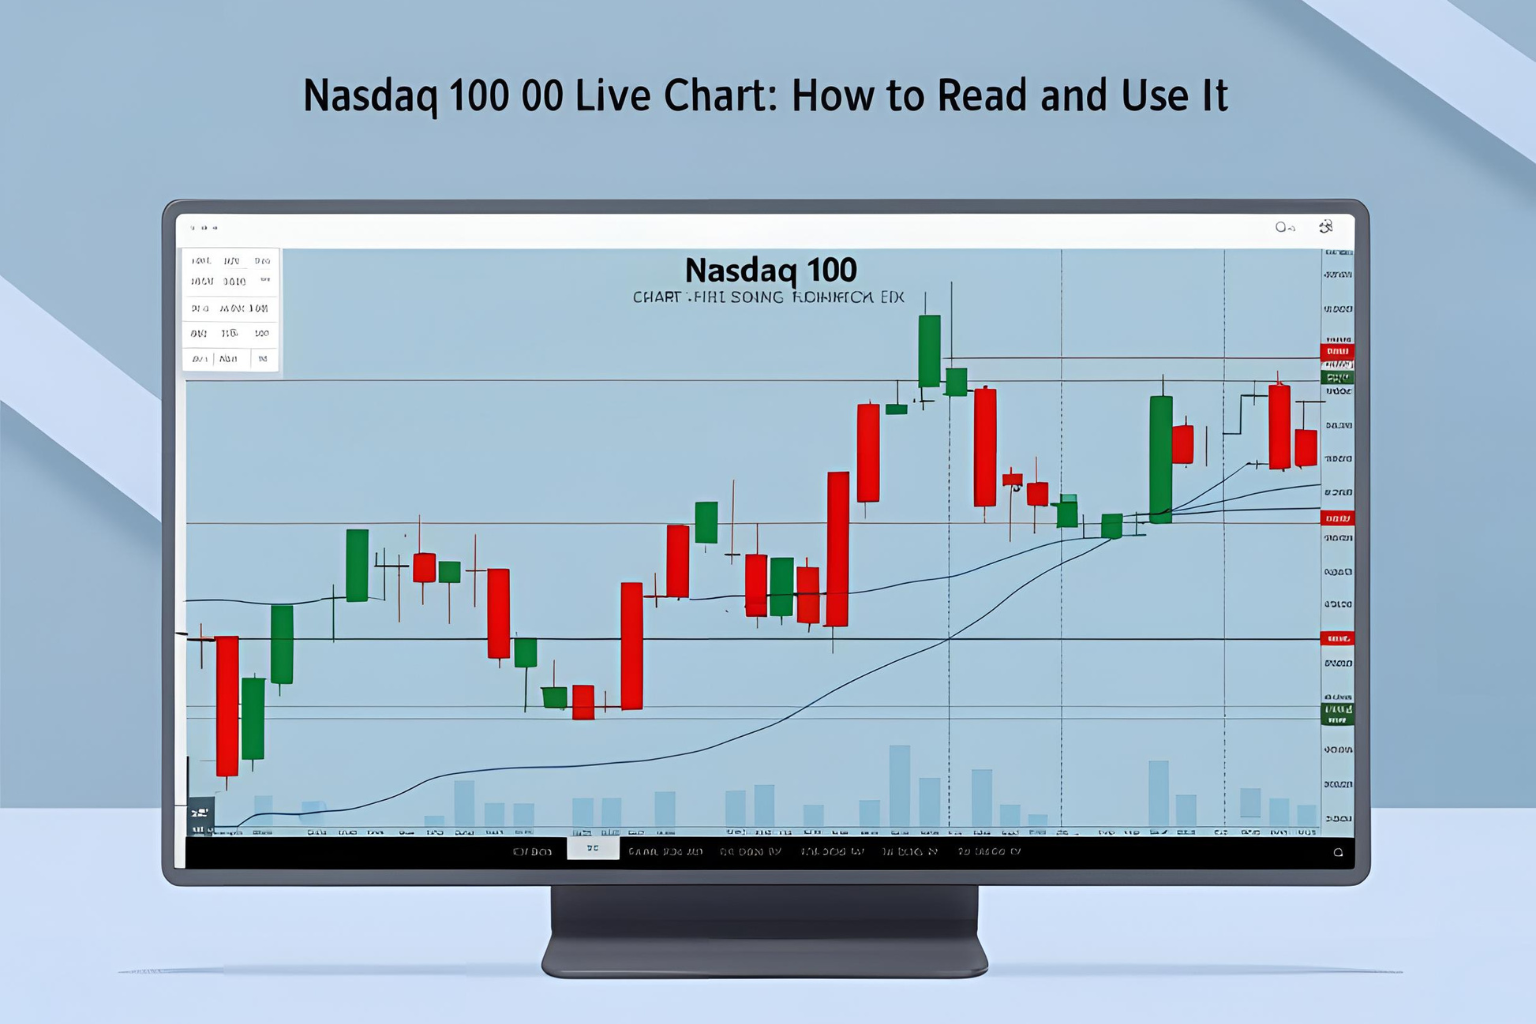
Nasdaq 100 Live Chart: How to Read and Use It
The Nasdaq 100 live chart is one of the most essential tools for traders and investors. Whether you’re analyzing trends, planning entries, or checking market sentiment, real-time chart data helps you make better decisions.
This guide will show you how to read the Nasdaq 100 chart, choose the right chart type, and use indicators for actionable insights.
What Is a Live Chart?
A live chart shows the real-time price movement of an asset. In this case, it displays the Nasdaq 100 index’s movements tick-by-tick or minute-by-minute. These charts help you:
- Monitor current price levels
- Identify trends and patterns
- Time entries and exits accurately
- Track volume and volatility
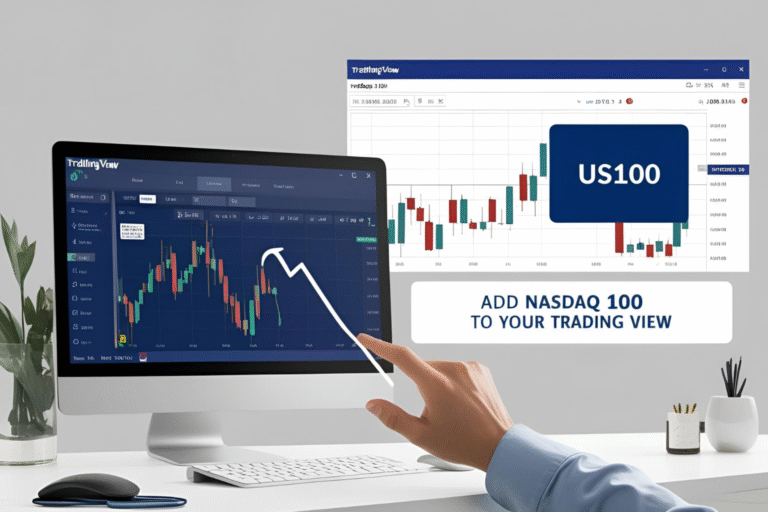
Where to View Nasdaq 100 Live Charts
Some of the best platforms offering Nasdaq 100 charts include:
- TradingView (
NDXorUS100) - Yahoo Finance
- Investing.com
- MetaTrader 4/5 (via brokers, symbol:
NAS100orUS100) - Nasdaq.com (official index page with delayed quotes)
Key Chart Types to Understand
- Line Chart
- Simple and clean
- Best for quick trend overviews
- Candlestick Chart
- Most commonly used by traders
- Shows open, high, low, and close (OHLC)
- Great for pattern recognition
- Bar Chart
- Similar to candlesticks but less visual
- Useful for advanced chartists
How to Read the Nasdaq 100 Live Chart
1. Timeframes
Choose based on your strategy:
- 1-minute or 5-minute: Intraday scalping
- 15-minute to 1-hour: Short-term trades
- Daily or weekly: Long-term investing
2. Price Levels
- Use horizontal lines to mark support and resistance
- Watch previous highs/lows to identify key zones
3. Indicators
Apply technical tools like:
- Moving Averages (MA) – Trend direction
- RSI – Overbought/oversold conditions
- MACD – Trend strength and momentum
- Volume – Confirms price action strength
Tips for Using Nasdaq 100 Live Charts Effectively
- Always confirm with multiple indicators
- Avoid relying on just one timeframe
- Use alerts to monitor key price levels
- Study historical movements during major events
Final Thoughts
A Nasdaq 100 live chart is more than just a price display—it’s a powerful analysis tool. Whether you’re a day trader or a long-term investor, learning how to read and use these charts can significantly improve your decision-making and trading performance.
FAQs
Where can I find a free Nasdaq 100 live chart?
Websites like TradingView, Yahoo Finance, and Investing.com offer free, real-time charts.
What’s the best chart type for beginners?
Candlestick charts are the most informative and widely used for all skill levels.
Can I trade directly from a chart?
Yes. Many platforms like TradingView or broker apps allow placing orders directly from chart interfaces.
How often does the Nasdaq 100 chart update?
Live charts update in real-time during market hours, with tick-by-tick or second-based refresh rates.
What’s the best timeframe to analyze Nasdaq 100?
It depends on your goal. Use lower timeframes for intraday trading and higher timeframes for long-term investment analysis.